


12. Inform or Persuade?
Risk Perceptions are Key Drivers of Behaviour

Communicating Personalised Covid-19 Risk
My natural frequency diagrams were a blunt tool, as they represented the average age-stratified risk for all people in that age group, regardless of comorbidity. The absolute risk for those of working age with no co-morbidities was always low. Even in the very elderly, many more people with the infection survived than died with Covid-19, as was evident from the Diamond Princess example.

Doctors use risk calculators to provide individualised risk estimates for a number of conditions. I had high hopes for the ‘Qcovid’ risk calculator, but unfortunately it was not licensed or intended for individual clinical risk communication. Nevertheless, even before vaccination, the Qcovid calculator yielded some surprising results in terms of absolute and relative risk of hospital admission and death.
Consider Your Aims
In April 2021, Spiegelhalter and researchers at the Winton Centre for Risk and Evidence Communication, published an evidence-based set of guidelines for practitioners attempting to communicate people's individual risk from COVID-19 ‘in such a way as to suit their own aims’.
This is an important qualifier, explicitly recognising that risk communication tools can be designed to suit a particular agenda and manipulate risk perception. They premise their conclusions,
’Communicators first need to consider where their aims fall on the spectrum from purely informing individuals of the risk to outright persuasion to follow a certain behavioural outcome. Many of the design and communication choices that need to be made will be based on whether the communicator wants the message to be persuasive, and if so, in what direction’.
If we can understand how the tools of risk communication influence our perceptions of risk, then we can, in addition, learn to spot when we may be being manipulated. Informed consent requires information to be presented objectively, without attempting to persuade. Persuasive messages are often more simplistic, but are intrinsically less trustworthy for that reason. We have seen how this played out in 2020, where persuasive risk communication caused people to massively overestimate risk.
A Dread Risk
Echoing the results of the UK Kekst CNS Coronavirus Tracker and US Franklin Templeton-Gallup surveys, those surveyed in the Winton study tended to greatly overestimate the absolute risks of dying from Covid-19 if infected. The correlation between perceived risk and actual risk was weak, suggesting that perceived and actual risk are not closely related:
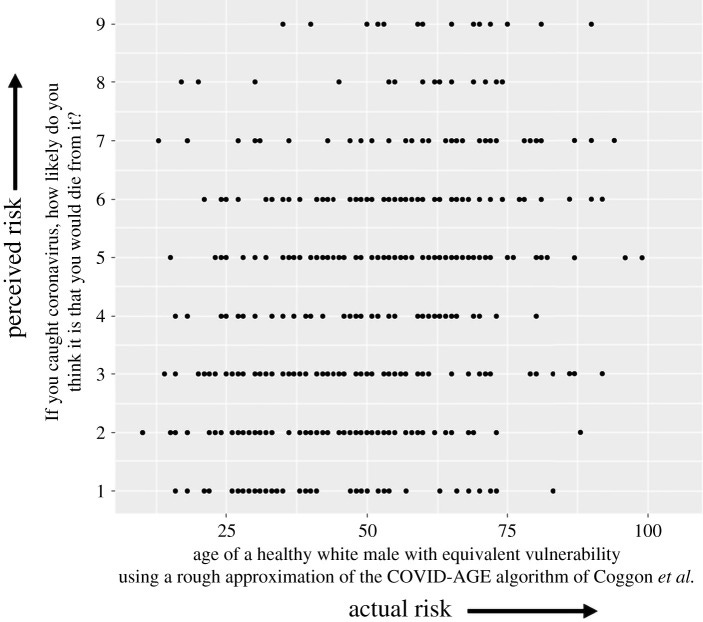
The authors postulate a combination of reasons for this overestimate, namely ‘availability bias’ due to extensive Covid-19 media coverage, and the emotional aspect of risk perception. Cumulatively this creates perception of a ‘dread risk’ (new, little-understood, no control over, potentially fatal, etc.).
Higher numeracy was associated with lower risk perception and decreased emotional risk perception, particularly as risks became lower. This might indicate a greater familiarity with numerical risks and hence a more ‘realistic’ view of the numbers associated with the risks.
Participants’ estimates of their own chance of dying from COVID-19 if infected, based on their own personal risk factors, were also often inaccurate. As the authors point out, risk perceptions are key drivers of behaviour, which can be protective but can also be harmful. Skewed high risk perceptions can lead to ‘worry, anxiety and behaviours whose harms may be greater than their benefits’, and low ones to ‘inadequate protective behaviours’, which they caution has ‘both individual and societal consequences’.
When public health bodies choose to provide information designed to influence people’s perception of risk, in order to produce a desired behavioural outcome, they must also take some responsibility for the undesired consequences.

Risk perception can be influenced by the way data is framed:
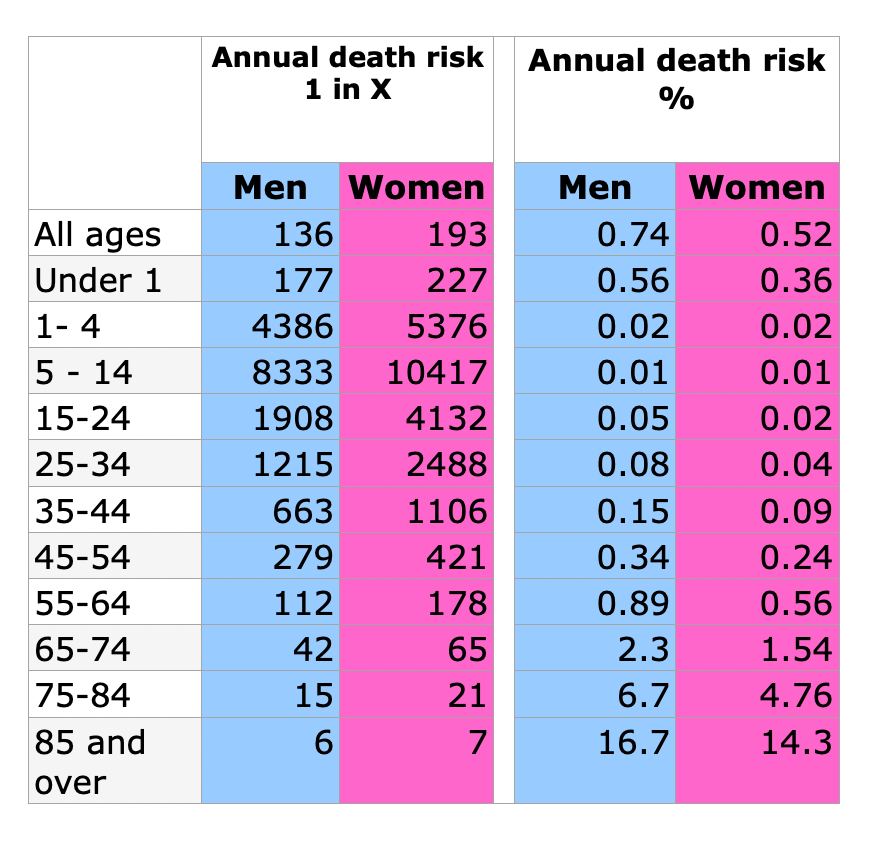
1. Percentages and Frequencies: Percentages are easier to understand and make risk seem lowest, whereas expressing risk as a frequency (eg x out of 1000) conveys a higher perception of risk. As an example, the actuarial (usual) annual risk of death by age and sex in the UK can be presented as a table of frequencies, but the same risk presented as a percentage is perceived as lower:
2. Positive and Negative Framing: Participants preferred being shown the number of people likely to survive, rather than the number likely to die, and seemed to find the result less concerning. However, participants seeing positive framing may have also understood the numbers less well. The authors recommend using negative framing but including a single translation to the positive within the format (e.g. ‘We would expect 2 in 1000 people to die… that means that 998 out of 1000 would survive’).
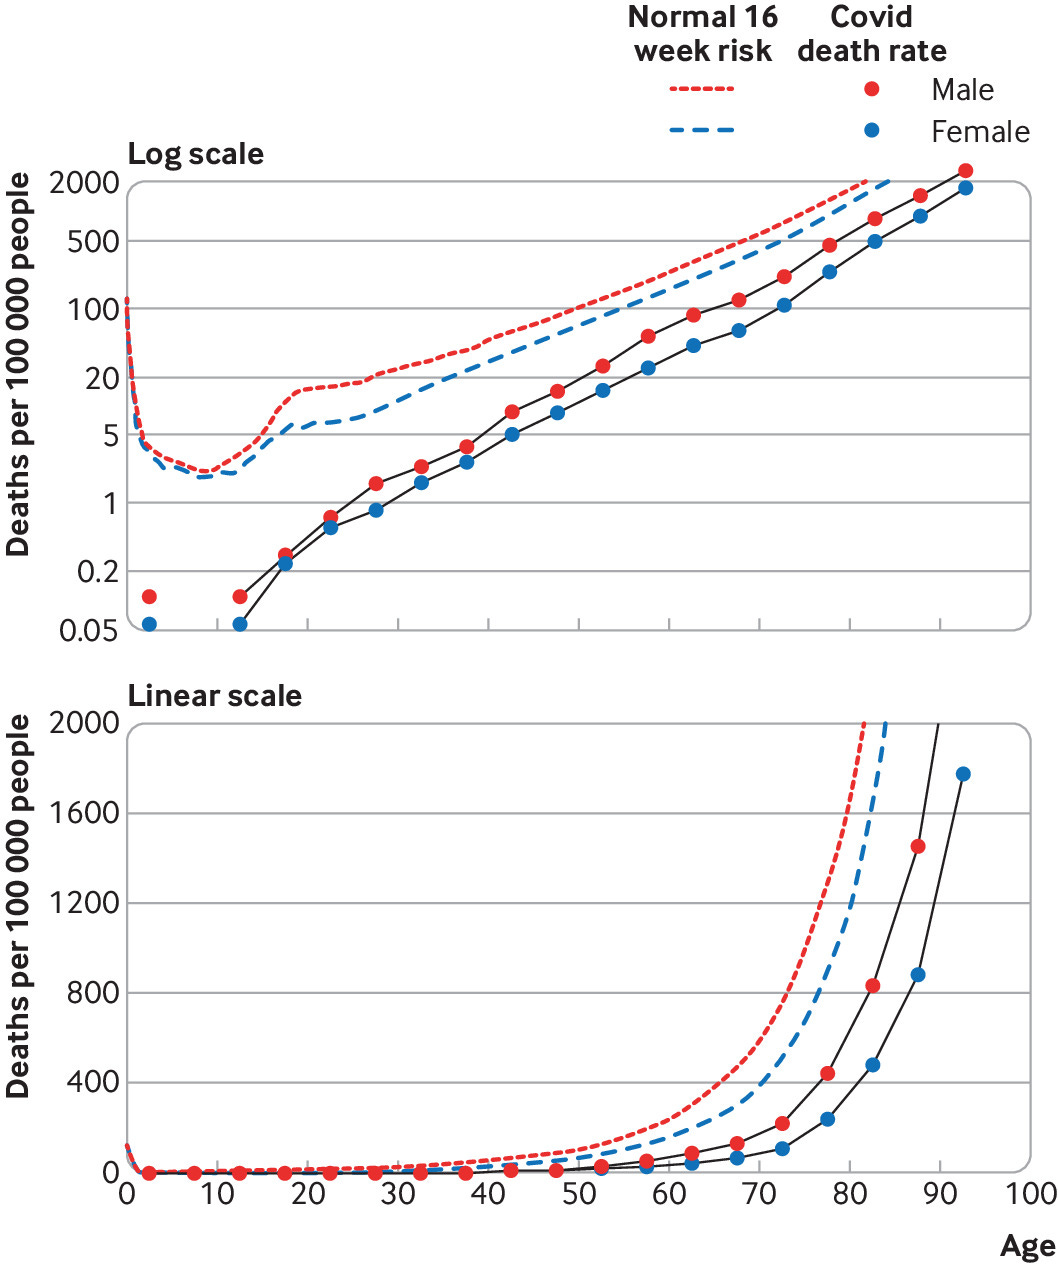
3. Visual Scales: Most participants were confused by a logarithmic scale and considered it less trustworthy than a linear scale. In Spiegelhalter’s BMJ paper, I preferred the linear to the log scale for the population fatality rates:
4. Providing Context: An absolute risk figure (e.g. ‘2% chance of dying if you catch COVID-19’) is, on its own, generally unhelpful, so context is needed. Choosing contextual information that is ‘informative’ without being ‘persuasive’ is difficult.
People in the study found the most useful comparators were the absolute risks faced by individuals of defined risk factors, covering the full range from very low-risk individuals (eg Mel is a white man aged 30 with no underlying health conditions) to very high-risk individuals (Sam is an Asian man aged 85 with a heart condition and diabetes). In other words, putting numbers against a series of ‘personas’ was the most helpful way of visualising comparative risk.
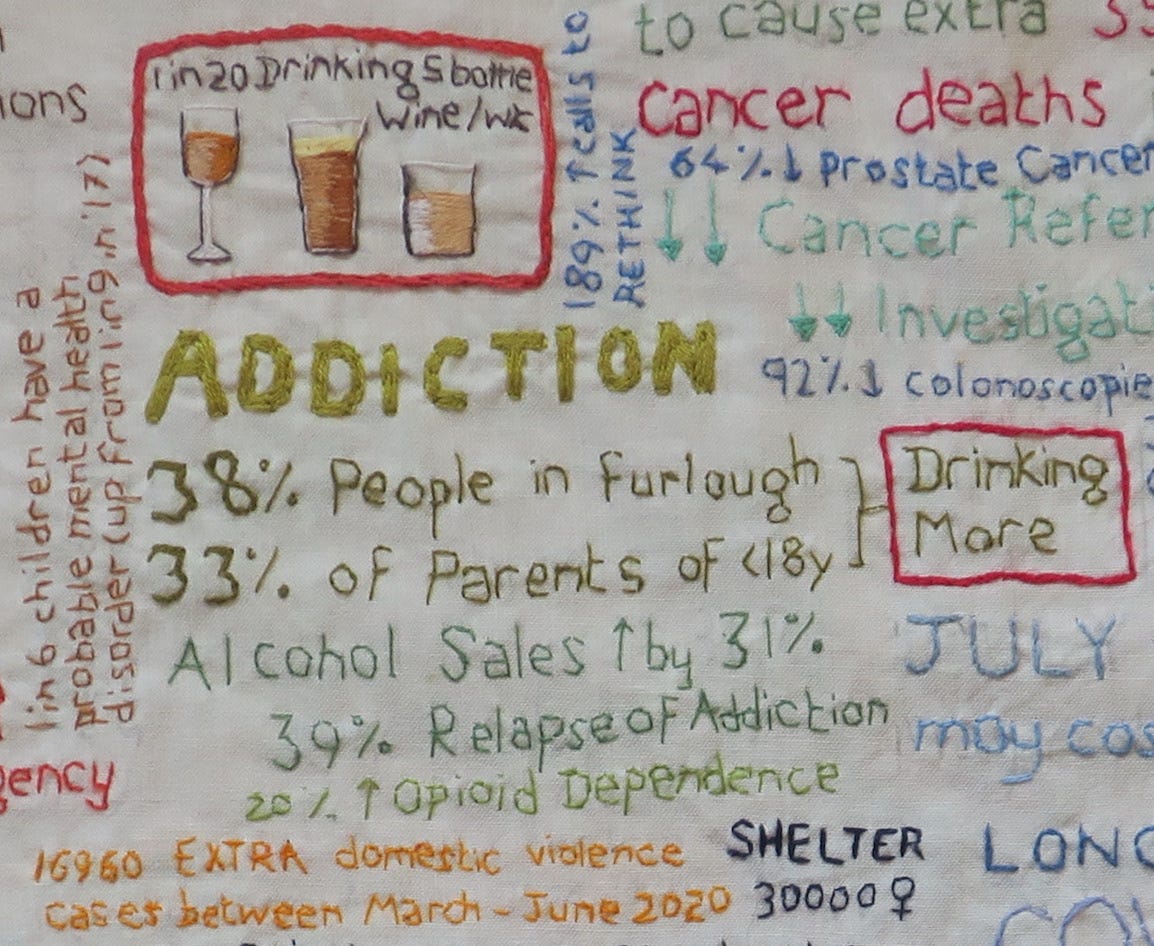
Seasonal ‘flu’ risk is a reasonable comparator to Covid-19, but interestingly, some other comparisons can be too abstract to be helpful. Take, for instance, deaths from drugs and alcohol: In Scotland in 2021, Covid-19 was categorised as the underlying cause of 4832 deaths, and a contributing factor in a further 986 deaths. By comparison, the same year also saw 1330 drug deaths in Scotland, the second highest annual drug death rate on record, only 1% down on 2020. 65% of these deaths were in people aged 35-44y. There were an additional 1245 alcohol deaths, a 5% increase on 2020, average age 59y.
Personally, I think this could be a useful way of emphasising the fact that other preventible harms were made considerably worse by pandemic lockdown policies, and that those other risks disproportionately affected younger people. However, the results of this study show that for the individual, comparing the risk of death from Covid-19 with most other causes of death is not intuitively useful.
Every risk can be managed away
In the study, physicians and the public appeared conflicted about what they wanted from a risk communication tool. They preferred it to be neutral, trustworthy, objective, personalised and informative, but worried that too honest risk communication might lead people to make the ‘wrong’ behavioural choices.
Physicians found themselves in a bind when the objective clinical advice they wanted to give, conflicted with government advice. There was a recognition of the mismatch between perceptions of risk and actual risk, when the study authors recognised the challenge of communicating ‘potentially highly emotional information, which may challenge people's prior perceptions about the risk, triggering identity-protective cognition, to diverse audiences’.
Some physicians in the study recognised that the UK public were being ‘infantilised’ by certain clinicians (who implied to them that ‘every risk can be managed away’) as well as by the government. They could see that patients had become used to being given simplified instructions, rather than information on which to make their own decisions. In the face of uncertainty, people had learned to defer to an authority, instead of ‘taking the risk of thinking for themselves’.

Surveyed doctors felt it was important that patients made their own decision about certain risks, as those decisions would be informed by their own values. However, many also commented on how a risk communication tool could have a negative effect on the mental well-being of patients. Only one doctor detailed how a tool like this would empower them to talk openly with their patients who were unnecessarily concerned, which for some had resulted in deteriorating mental health.
In fact, the majority of study participants said they would actually appreciate being given more detailed information on which to base their own risk decisions. They wanted trustworthy, personalised information on risk of dying from COVID-19 (much of which was not available in 2020). However, when asked their opinions on whether the aim of personal risk communication about Covid-19 should be as neutral as possible just to ‘inform people’ or whether the aim should be to ‘persuade people’ in order to change their behaviour, 63% of participants chose a mark on the Likert scale above the half-way point towards the tool being ‘persuasive’. 61% of those same participants agreed with the statement, ‘it should try to make people be more cautious by showing that even if the risk is low to them, they can spread it to others’.
This particular study finding was summarised as:
‘the majority of the UK population wanted a tool giving people their personalised risk from COVID-19 to be persuasive, so that it would make others more cautious in their behaviour.’
Though this makes for a neat soundbite, the study participants were not in a neutral frame of mind, having been primed by months of intense government propaganda and fear messaging. There was a climate of anxiety, causing atmospheric bias, which would have influenced their responses, and which undoubtedly underpinned their high levels of concern about the virus.
Along with a myriad of other harms, the dangers inherent in skewed risk perception include institutional anxiety, creating barriers in access to care, and public anxiety, creating delays in health-seeking behaviour.